Portfolio Details
Credit Portfolio Risk Analysis
This PowerBI dashboard offers a sophisticated analysis of credit portfolio risk across the United States, utilizing advanced data visualization and the DAX programming language to deliver actionable insights.
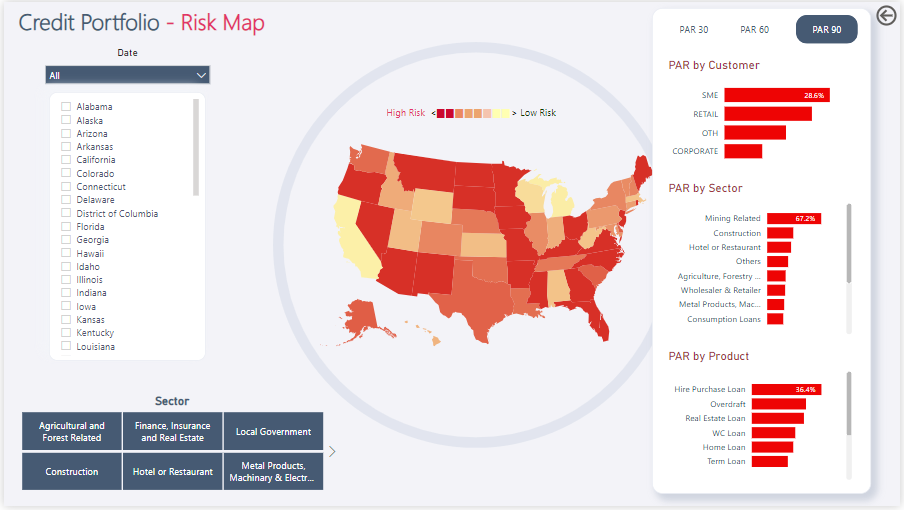
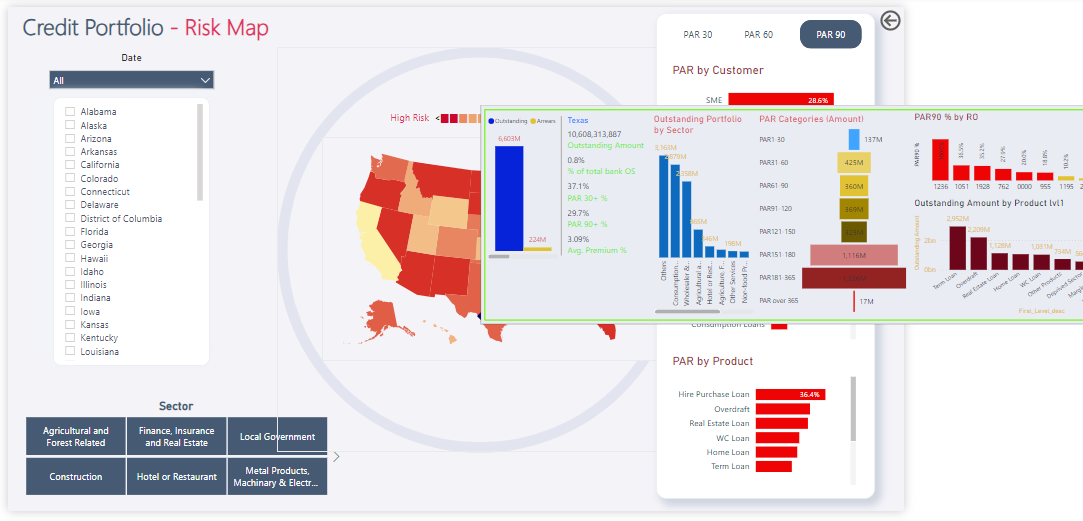
Geospatial Risk Mapping
A filled map of the USA, complemented by interactive tooltips, displays the Portfolio at Risk (PAR) metrics for 30, 60, and 90 days. This visualization effectively highlights geographic risk distributions, allowing for a quick assessment of high-risk areas.
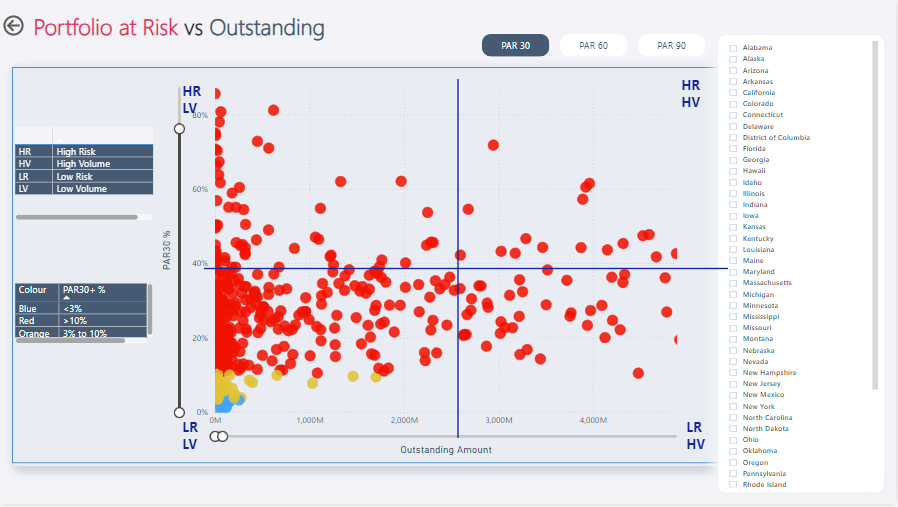
Risk Segmentation
A scatter plot categorizes states into four segments—high volume-high risk, low volume-low risk, and two others—enabling clear identification of risk concentration. DAX is used to dynamically calculate and categorize the data, ensuring precise and insightful segmentation.
Multi-Dimensional PAR Analysis
Detailed visualizations provide insights into PAR by customer, sector, product, and other key features. Here, DAX programming facilitates complex calculations, while bar charts and line graphs are employed to compare risk metrics across various dimensions.
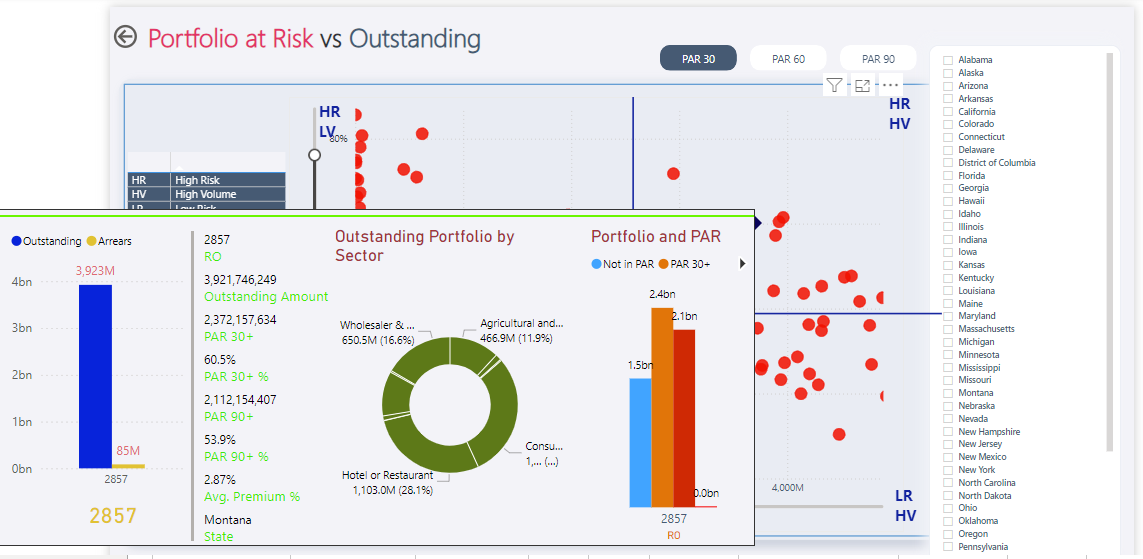
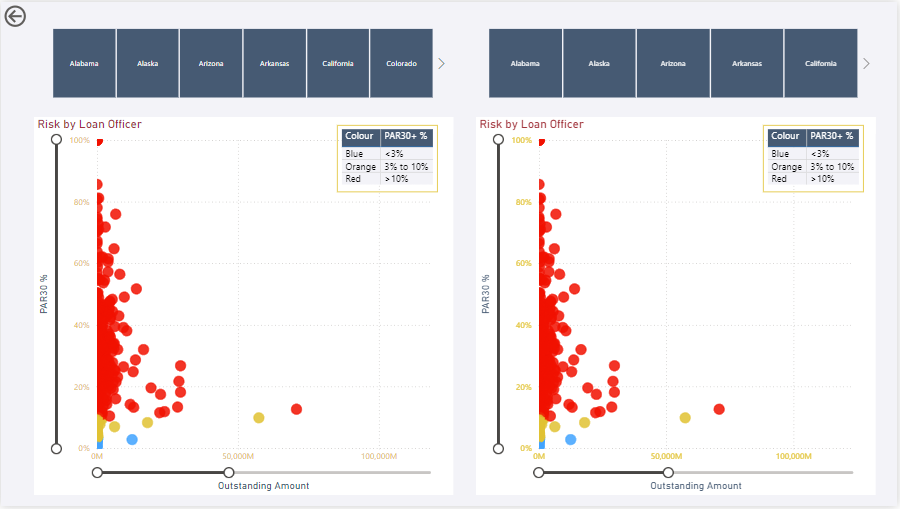
Comparative State Analysis
Dual scatter plots allow for side-by-side comparisons of risk exposure across states. This visualization is instrumental in identifying regional trends and anomalies, offering a deeper understanding of credit risk dynamics.
This project underscores the integration of PowerBI’s powerful visualization tools with DAX programming to deliver a comprehensive and nuanced view of credit risk, empowering informed decision-making.
Project information
- Tools: PowerBI ,DAX
- Source: Kaggle
- Project date: 01 September, 2024